How to improve business outcomes with data normalization and enrichment
Date: January 30th, 2023
There are lots of different data challenges in monitoring and managing IT environments, but the biggest and most significant is knowing what your data is telling you. That takes a lot more than just raw data. Data itself doesn’t tell a story, so the challenge is giving it a coherent form and structure, one that provides you not only with significant insights into your environment but also points you in the direction of next steps.
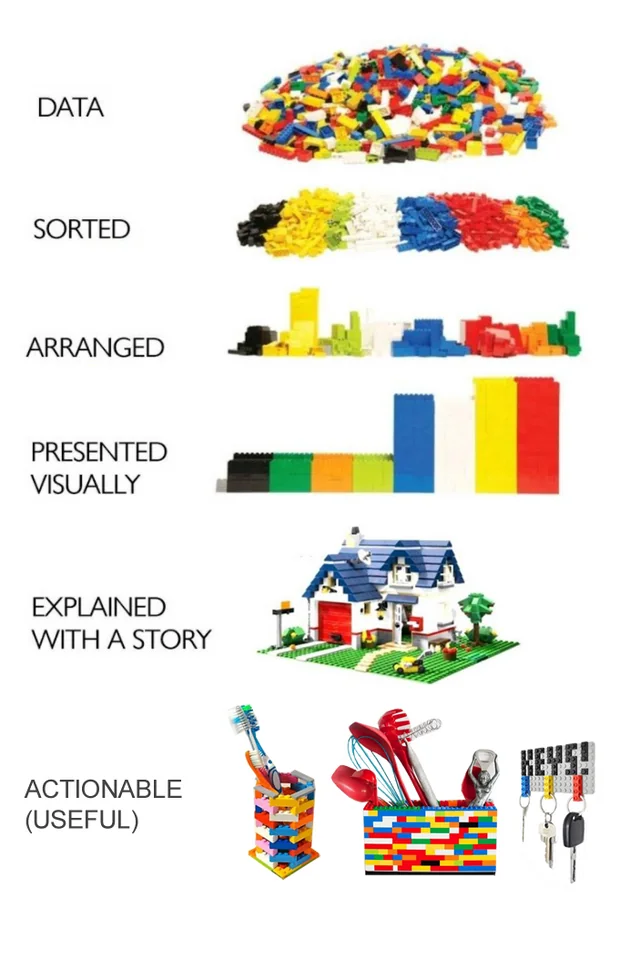
A popular meme helps explain the problem:
Most of the data we get comes in a raw form, unsorted, unorganized, and incoherent, like a pile of random Lego bricks. While some of the pieces might make sense on their own, the key is in making them make sense a whole, getting the big picture.
Getting the big picture means first sorting and arranging the data. This lets you see what you have, how much you have, and allows you to visualize possibilities for turning the data into a coherent whole. In the Lego example, the bricks have been sorted according to color and then arranged into well-organized piles.
If we were to draw a parallel to IT asset data management, the first three stages would represent the move from raw to aggregated to normalized data. Data coming in from a variety of different sources needs to be aggregated in a single place, sorted into relevant data types, and then arranged into meaningful categories.
Author:
Related links:
Share blog:
IT Visibility: How a technology catalog changes how you see your data
In this whitepaper, you’ll discover:
- How normalization and enrichment can make your data smarter and more effective
- How key IT data can help drive and optimize business initiatives
- How you can improve infrastructure security with IT visibility
- How key IT data can help you align your software portfolio with business initiatives for savings and new efficiencies
Data normalization improves IT visibility
Normalization is a key stage in this process. It’s what turns all that raw data into information that can be consumed and used by humans instead of just machines. (Although this process can also make it easier for machines to use the data and contributes significantly to automation efforts.) It’s essentially a process for translating raw data into regular and meaningful bits of information by giving it a consistent and standardized form.
Arranging the data into meaningful categories depends entirely on the kind of data you’re working with. While it might make sense to arrange customer data into categories such as name, address, products purchased, and so forth, those categories obviously won’t work for IT assets. The categories have to make sense for the kinds of problems you need your data to solve. For IT management, these categories include:
- Name
- Vendor
- Business function & category
- Description
- Product family
- Platform
- License type
- Latest version
- CVE vulnerabilities
- Release date
- End-of-Life & End-of-Support date
This stage is part of data enrichment. Enrichment takes non-discoverable, commercial data, and combines it with the discoverable data to give you a better understanding of what the discoverable data means and what you can do with it.
Enrich data to optimize your IT infrastructure
There are a number of reasons to enrich your data with commercial information. For instance, by comparing the installed version with the most recent version and correlating that with the number of installations, you can see whether your infrastructure is vulnerable because of a recently discovered security gap. You can use that information to quickly locate the vulnerable devices and patch them effectively, without having to perform unnecessary updates on all your end devices.
You can also use it to optimize your software spend. You can classify your installed software according to business function. Then you can see how many different kinds of software you have performing the same function. Are you paying a lot for different subscriptions for enterprise chat software? Can you get a better deal by adopting a single solution for your entire organization and purchasing bulk, enterprise licenses?
Using stories to talk about data gives you much better insight into your IT environment than the raw data itself. They provide not only structure and form to the data but reason and purpose. We don’t gather data just for the sake of gathering data; no, we gather data to secure our environment, to optimize costs and performance, and to improve our products, services, and solutions.
If you’d like to learn more about how normalization and enrichment for IT asset management can improve your business outcomes, read our latest whitepaper.
Reading time: 3 minutes
January 30th, 2023 | Lara Iding
There are lots of different data challenges in monitoring and managing IT environments, but the biggest and most significant is knowing what your data is telling you. That takes a lot more than just raw data. Data itself doesn’t tell a story, so the challenge is giving it a coherent form and structure, one that provides you not only with significant insights into your environment but also points you in the direction of next steps.
A popular meme helps explain the problem:
Most of the data we get comes in a raw form, unsorted, unorganized, and incoherent, like a pile of random Lego bricks. While some of the pieces might make sense on their own, the key is in making them make sense a whole, getting the big picture.
Getting the big picture means first sorting and arranging the data. This lets you see what you have, how much you have, and allows you to visualize possibilities for turning the data into a coherent whole. In the Lego example, the bricks have been sorted according to color and then arranged into well-organized piles.
If we were to draw a parallel to IT asset data management, the first three stages would represent the move from raw to aggregated to normalized data. Data coming in from a variety of different sources needs to be aggregated in a single place, sorted into relevant data types, and then arranged into meaningful categories.
In this whitepaper, you’ll discover:
- How normalization and enrichment can make your data smarter and more effective
- How key IT data can help drive and optimize business initiatives
- How you can improve infrastructure security with IT visibility
- How key IT data can help you align your software portfolio with business initiatives for savings and new efficiencies
Normalization is a key stage in this process. It’s what turns all that raw data into information that can be consumed and used by humans instead of just machines. (Although this process can also make it easier for machines to use the data and contributes significantly to automation efforts.) It’s essentially a process for translating raw data into regular and meaningful bits of information by giving it a consistent and standardized form.
Arranging the data into meaningful categories depends entirely on the kind of data you’re working with. While it might make sense to arrange customer data into categories such as name, address, products purchased, and so forth, those categories obviously won’t work for IT assets. The categories have to make sense for the kinds of problems you need your data to solve. For IT management, these categories include:
- Name
- Vendor
- Business function & category
- Description
- Product family
- Platform
- License type
- Latest version
- CVE vulnerabilities
- Release date
- End-of-Life & End-of-Support date
This stage is part of data enrichment. Enrichment takes non-discoverable, commercial data, and combines it with the discoverable data to give you a better understanding of what the discoverable data means and what you can do with it.
There are a number of reasons to enrich your data with commercial information. For instance, by comparing the installed version with the most recent version and correlating that with the number of installations, you can see whether your infrastructure is vulnerable because of a recently discovered security gap. You can use that information to quickly locate the vulnerable devices and patch them effectively, without having to perform unnecessary updates on all your end devices.
You can also use it to optimize your software spend. You can classify your installed software according to business function. Then you can see how many different kinds of software you have performing the same function. Are you paying a lot for different subscriptions for enterprise chat software? Can you get a better deal by adopting a single solution for your entire organization and purchasing bulk, enterprise licenses?
Using stories to talk about data gives you much better insight into your IT environment than the raw data itself. They provide not only structure and form to the data but reason and purpose. We don’t gather data just for the sake of gathering data; no, we gather data to secure our environment, to optimize costs and performance, and to improve our products, services, and solutions.
If you’d like to learn more about how normalization and enrichment for IT asset management can improve your business outcomes, read our latest whitepaper.
Share this blog post: